The Communication and Information network Association of Japan (CIAJ) announces the telecommunication equipment production and trade figures for Q1 (April-June) of FY2020 as follows.
I. Summary
In April through June 2020, the Japanese economy shrank for a third consecutive quarter, with real GDP decreasing at an annual rate of 27.8%, according to preliminary estimates. As private consumption and business spending weakened amid the stagnation of economic activity triggered by declaration of a state of emergency and other effects of the COVID-19 pandemic, domestic demand contracted for a third consecutive quarter. With inbound demand falling sharply as well due to the pandemic, exports also fell for a second straight quarter.
Looking specifically at the telecom market, demand for consumer equipment and business equipment declined, reflecting weaker private consumption and business spending. However, demand for network equipment was strong. In preparation for an increase in traffic stemming chiefly from the utilization of 5G (fifth-generation mobile communication systems) services, demand for wireline network equipment which will form the backbone network continued to increase. Bolstered also by an uptick in demand for mobile phone infrastructure equipment coinciding with expansion of network equipment for carriers and data centers primarily to meet telework demand, demand for network equipment grew.
(1) Domestic Market Trends
The value of the domestic market (= value of domestic production – value of exports + value of imports) in April through June was 598.2 billion yen, increasing 6.0% year on year, the first growth for four quarters.
Due to the growth in demand for network equipment, the value of domestic production and the value of imports increased.
(2) Domestic Production
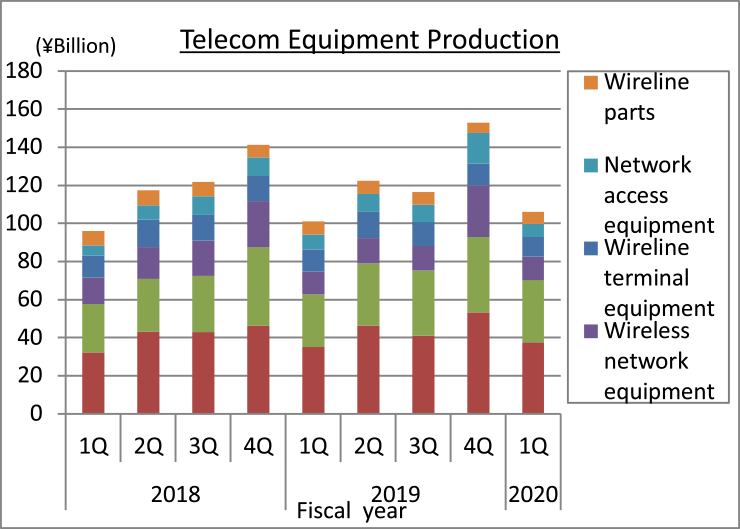
The value of domestic production in April through June was 106.0 billion yen, representing positive growth of 4.8% over the same quarter of the previous year and marking the second straight positive quarter. Domestic production increased overall due to strong year-on-year performances in digital transmission equipment and base station communications equipment for infrastructure projects, offsetting decline in telephone sets and mobile phones for consumers and key phones and PBX for business use.
(3) Exports
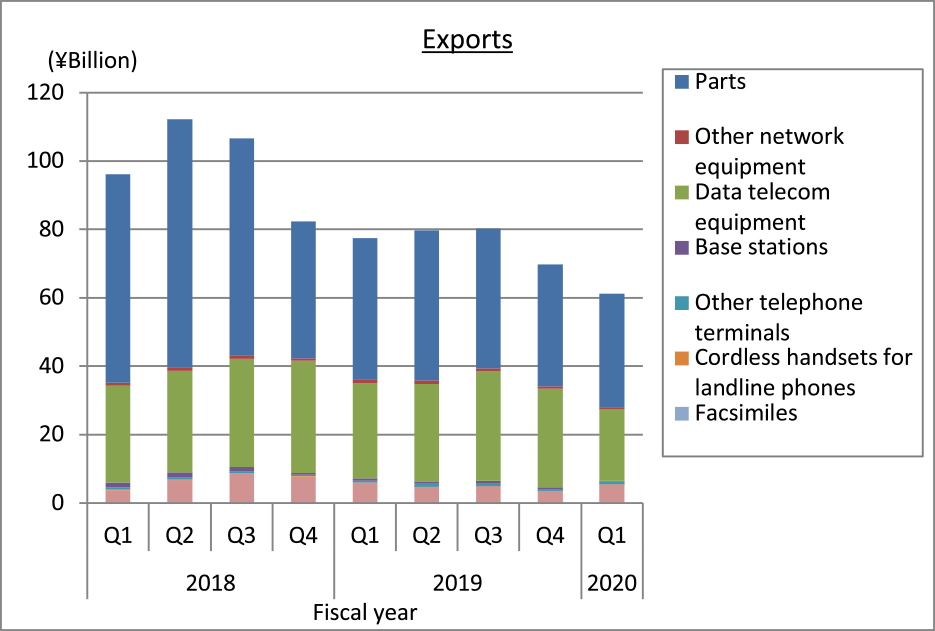
The total value of exports in April through June was 61.3 billion yen, representing negative growth of 21.0% over the same quarter of the previous year and continuing a streak of sharp declines. Against the backdrop of weakening smartphone demand in China and other Asian economies, demand for parts used in local smartphone production decreased, and, with production also suspended in response to COVID-19, exports of parts used in the production of smartphones fell sharply. Business spending also fell due to the recession, and the total value of exports fell for a seventh straight quarter.
(4) Imports
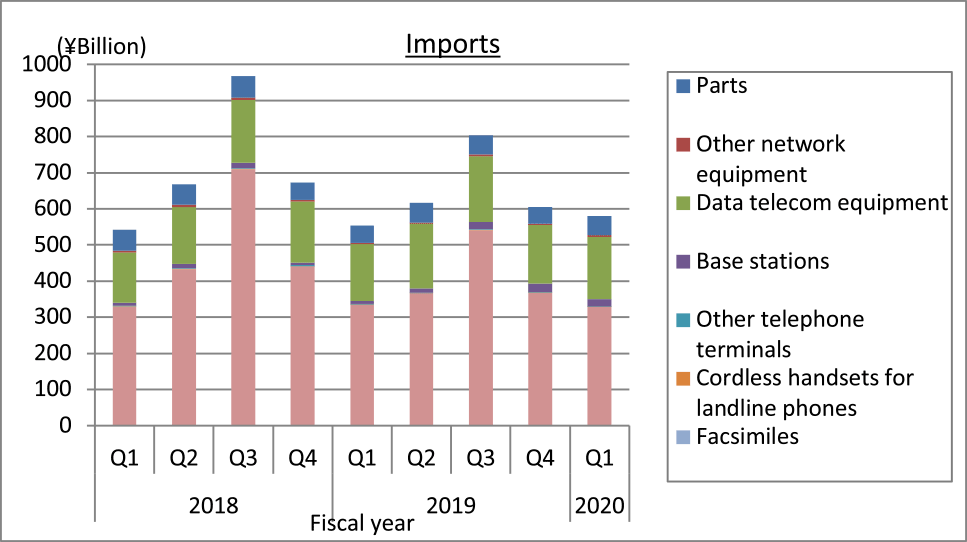
The total value of imports in April through June was 580.5 billion yen, representing positive growth of 2.1% over the same quarter of the previous year and moving into positive territory for the first time in four months. The total value of imports increased due to growth in switching and routing equipment, and other data telecom equipment (transmission equipment, communications equipment, modem, etc.) in the data telecom equipment category resulting from strong domestic demand for wireline network equipment.
II. Domestic Market Trends
(Aggregated by CIAJ based on Indices of Industrial Production and Trade Statistics of Japan)
(1) Detailed trends by categories
Actual figures for April through June by category are as follows.
The size of the domestic market (including the value of imports of foreign brands) was calculated from government figures, the Indices of Industrial Production and Trade Statistics of Japan, according to the following formula: Domestic market size = value of domestic production – value of exports + value of imports
Terminal equipment :
371.7 billion yen (-1.5% over the same quarter of the previous year)- Network equipment :
226.5 billion yen (+21.1% over the same quarter of the previous year)
III. Domestic Production
(Aggregated by CIAJ based on Indices of Industrial Production compiled by the Ministry of Economics, Trade and Industry)
(1) Detailed trends by categories
Actual figures for April through June by category are as follows.
Wireline terminal equipment 10.2 billion yen (-11.4% over the same quarter of the previous year)
Of this, telephone sets declined to 400 million yen (-7.4% over the same quarter of the previous year), key telephones to 3.1 billion (-3.7% over the same quarter of the previous year), and intercoms to 6.6 billion (-14.9% over the same quarter of the previous year).
Demand for categories that meet personal and household use showed signs decline due to lost buying opportunities and delays in new construction because of COVID-19.
Domestic production of key phone also remained in a downward trend partly due to decline in business spending caused by COVID-19, offsetting growth in demand for large capacity models of the shift away from PBX.Mobile terminal equipment 37.5 billion yen (+6.5% over the same quarter of the previous year)
Of which, mobile phones was 23.8 billion yen (-16.5% over the same quarter of the previous year).
The total volume and value of domestic mobile phone production decreased mainly due to lost in-store buying opportunities, despite an increase in domestic smartphone production volume on the back of firm smartphone replacement demand.
Domestic production of other mobile terminal equipment besides mobile phones increased sharply mainly due to the replacement of commercial radio terminals and marine and aeronautical radio communication equipment.Wireline network equipment 32.6 billion yen (+18.9% over the same quarter of the previous year)
Of which, central office switching systems was 2.4 billion yen (+ 48.0% over the same quarter of the previous year), PBXs was 700 million yen (-49.0% over the same quarter of the previous year), digital transmission equipment was 14.6 billion yen (+67.5% over the same quarter of the previous year) and other transmission equipment was 13.5 billion yen (-6.6% over the same quarter of the previous year).
Domestic production of digital transmission equipment continued to grow due to expansion of wireline network equipment in anticipation of an increase in data traffic and greater investment in regions where optical cables have yet to be laid.
Exports also rose due to global internet traffic supply shortage.
Domestic production of PBXs decreased, reflecting weak demand amid decline in business spending and the streamlining and consolidation of domestic bases in response to deterioration in corporate earnings, despite government replacement demand.Wireless network equipment 12.5 billion yen (+3.7% over the same quarter of the previous year)
Of which, fixed telecommunication devices were 5.0 billion yen (-13.6% over the same quarter of the previous year) and base station equipment was 7.5 billion yen (+19.5% over the same quarter of the previous year).
Domestic production of fixed communications equipment decreased due to decline in demand for emergency radio base stations and satellite communications equipment for government and microwave communication equipment for the private sector.
The basic tendency for domestic production of base station equipment to remain flat continued despite growth over the same quarter of the previous year.Network access equipment 6.9 billion yen (-15.1% over the same quarter of the previous year)
Domestic production of network access equipment fell, reflecting decline in overall demand due to constraints on business spending despite expansion of carrier and data center equipment to accommodate telework demand fueled by COVID-19.
Wireline parts (includes relay equipment for wireline systems) 6.3 billion yen (-7.9% over the same quarter of the previous year)
Production continued to fall due to decline in demand for domestic production especially automotive products and decline in exports for the overseas production of smartphones for export.
IV. Exports
(Compiled by CIAJ, based on Ministry of Finance’s “Trade Statistics”)
(1) Detailed trends by categories
Actual figures for April through June by category are as follows (the facsimile category is no longer indicated from January 2018):
Telephone sets and terminal equipment 6.3 billion yen (-21.0% over the same quarter of the previous year)
Of this, mobile phones was 5.5 billion yen (-6.6% over the same quarter of the previous year), cordless handsets for landline phones was 70 million yen (+ 18.3% over the same quarter of the previous year), and other was 800 million yen (+34.4% over the same quarter of the previous year).
Exports of mobile phones to Asia increased, while exports to the U.S. decreased.Network equipment 21.8 billion yen (-26.7% over the same quarter of the previous year)
Of which, base stations was 200 million yen (-68.6% over the same quarter of the previous year), data communication equipment was 20.9 billion yen (-24.6% over the same quarter of the previous year) and other network equipment was 600 million yen (-50.2% over the same quarter of the previous year).
Exports were weak, reflecting decreased demand amid the global economic slump caused by COVID-19.Parts (both wireline and wireless) 33.2 billion yen (-19.8% over the same quarter of the previous year)
Exports of parts used in production fell due to global decline in the consumption of smartphones due to COVID-19 and deterioration in business spending against the backdrop of worsening trade tensions between the U.S. and China.
(2) Detailed trends by region
A breakdown of results for April through June by region shows that Asia was 35.5 billion yen (-21.2% over the same quarter of the previous year), of which China was 9.3 billion yen (-35.3% over the same quarter of the previous year). North America was 17.3 billion yen (-9.1% over the same quarter of the previous year), of which the U.S. was 17.1 billion yen (-9.2% over the same quarter of the previous year).
Europe was 6.2 billion yen (-39.8% over the same quarter of the previous year), of which the EU was 5.5 billion yen (39.9% over the same quarter of the previous year).
Exports to major export destinations such as Asia, Europe and the U.S. fell sharply due to the effects of COVID-19.
(3) Comparison and breakdown by regions
| First: | Asia | 58.0% (-0.2%over the same quarter of the previous year) |
| Second: | North America | 28.3% (+1.7% over the same quarter of the previous year) |
| Third: | Europe | 10.2% (-3.1% over the same quarter of the previous year) |
| Other regions | 3.5% (+1.6% over the same quarter of the previous year) |
V. Imports
(Compiled by CIAJ, based on based on Ministry of Finance’s ‘Trade Statistics”)
(1) Detailed trends by categories
Actual figures for April through June by category are as follows
Telephone sets and terminal equipment 330.4 billion yen (-2.0% over the same quarter of the previous year)
Of this, mobile phones was 327.9 billion yen (-2.0% over the same quarter of the previous year), cordless handsets for landline phones was 700 million yen (-39.7% over the same quarter of the previous year), and other was 1.7 billion yen (+13.9% over the same quarter of the previous year). Demand for mobile phones fell mainly due to lost in-store buying opportunities. Growth in the other category includes increased demand for remote conference systems.
Network equipment 196.2 billion yen (+16.0% over the same quarter of the previous year)
Of which, base stations was 19.6 billion yen (+122.1% over the same quarter of the previous year), data communication equipment was 172.1 billion yen (+10.6% over the same quarter of the previous year) and other network equipment was 4.6 billion yen (-2.2% over the same quarter of the previous year).
Demand for digital transmission equipment which will form the backbone of networks grew and demand for mobile phone infrastructure also went up, causing exports in these categories to rise.Parts (both wireline and wireless) 54.0 billion yen (+13.2% over the same quarter of the previous year)
(2) Detailed trends by region
A breakdown of results for April through June by region shows that Asia was 545.2 billion yen (+6.6% over the same quarter of the previous year), of which China was 406.2 billion yen (+8.4% over the same quarter of the previous year). North America was 13.8 billion yen (-24.4% over the same quarter of the previous year), of which the U.S. accounted for 13.3 billion yen (-22.7% over the same quarter of the previous year). Europe was 12.6 billion yen (+17.9% over the same quarter of the previous year), of which the EU was 12.4 billion yen (+19.8% over the same quarter of the previous year). Imports of parts and base stations rose sharply, driven by increased imports from China and Europe.
(3) Comparison and breakdown by regions
| First: | Asia | 93.9% (+1.6% over the same quarter of the previous year) |
| Second: | North America | 2.2% (+0.3% over the same quarter of the previous year) |
| Third: | Europe | 2.4% (-0.9% over the same quarter of the previous year) |
| Other regions | 1.5% (-1.0% over the same quarter of the previous year) |
VI. Trends in Orders Received and Shipped
(from CIAJ statistics)
(1) FY2020 1st quarter actual
CIAJ statistics for total orders received and shipped in April through June amounted to 322.1 billion yen, representing negative growth of 12.3% over the same quarter of the previous year. Of which, the total value of domestic shipments was 272.0 billion yen, representing negative growth of 7.2% over the same quarter of the previous year) and exports was 50.1 billion yen, representing negative growth of 32.5% over the same quarter of the previous year).
*CIAJ statistics for total orders received and shipped = orders received and shipped by CIAJ member companies
(=value of shipments for the domestic market (domestic production + foreign production) + value of exports = value of domestic production + value of imports of products produced abroad)
(2) Trend by categories
Actual figures for April through June by category are as follows:
Wireline terminal equipment 92.5 billion yen (-26.9% over the same quarter of the previous year).
Domestic demand for consumer equipment and business equipment fell, and exports of personal and office-use facsimiles (including multi-functioning devices), which are particularly sensitive to the effects of overseas economies, fell sharply.
Mobile terminal equipment 107.0 billion yen (-12.8% over the same quarter of the previous year).
Domestic demand for mobile phones shrank due to weak consumption dampened by COVID-19 in addition to falling demand largely due to the lengthening of the replacement cycle. Imports of other mobile equipment (commercial/MCA radio terminals, etc.) were firm.
- Wireline network equipment 54.0 billion yen (+16.5% over the same quarter of the previous year).
Demand for wireline network equipment such as digital transmission equipment, PON and media converters increased sharply and exports of digital transmission equipment were also solid.
- Wireless network equipment 55.7 billion yen (+1.4% over the same quarter of the previous year).
Domestic demand for fixed communications equipment shrank due to decline in demand for emergency radio base stations and satellite communications equipment for government and microwave communication equipment for the private sector. Meanwhile, exports of satellite communications equipment grew. Demand for base station equipment for carriers grew considerably.
- Other network equipment 6.8 billion yen (-31.3% over the same quarter of the previous year).
Demand decreased, reflecting lackluster business spending due to COVID-19.
- Communication equipment parts 6.1 billion yen (-14.1% over the same quarter of the previous year)


