The Communication and Information network Association of Japan (CIAJ) announces the telecommunication equipment and trade figures for October through December, 2016 as follows.
Japan’s GDP during October through December 2016 grew YoY (year-over-year) at an annual rate of 1.2% according to the second preliminary figures announced by the Cabinet Office. The number was ajusted upwards over the first preliminary figure. Capital investments in the privates sector was modified from 0.9% to 2.0%, and together with healthy export figures, was able to outbalance the decline in housing and public sector investments and reflects a continued gradual recovery.
However, the domestic production of telecom equipment showed a significant decline in Q3, with low capital investments in domestic facilities, continuing relocation of manufacturing to overseas locations and competition from foreign brands, all leading to the 7th consecutive negative YoY growth in the quarter since 2015 Q1. Exports decreased for the 4th straight quarter with the weaker yen from November, 2016 not enough to offset negative factors. An uptake in domestic demand for mobile phones and base stations pushed growth into positive figures for the first time since 2015 Q2.
I. Domestic Production
(Based on Indices of Industrial Production compiled by the Ministry of Exonomics, Trade and Industry and summarized by CIAJ)
(1) FY2016 Q3 actual
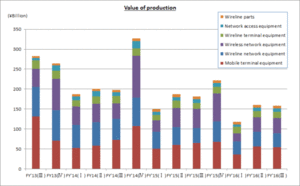
The total value of production was 158.5 billion yen, or negative 12.7% growth over the same quarter in FY2015. Signs of upgrade demand for enterprise telephone system were seen in the positive YoY growth. Domestic production of mobile phones and network equipment declined with the shift to production overseas and fierce competition from foreign brands.
The aggregate figure from Q1 through Q3 was 437.3 billion yen (-15.7% over the same period of the previous year).
(2) Trend by categories
Actual figures by categories were as follows:
- Wireline terminal equipment
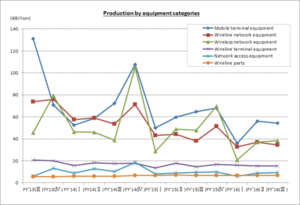
15.3 billion yen (+3.8% over the same quarter of the previous year). Of which telephone sets was 700 million yen (-2.4% over the same quarter of the previous year) and key telephones 5.6 billion yen (+12.0% over the same quarter of the previous year), intercoms 8.7 billion yen (+1.0% over the same quarter of the previous year) and facsimiles 400 million yen (-23.1% over the same quarter of the previous year). Key telephone figures were supported by upgrade demand, but the unit prices are trending downward. - Mobile terminal equipment
54.5 billion yen (-15.9% over the same quarter of the previous year). Of which mobile phones was 38.3 billion yen (-26.3% over the same quarter of the previous year) and public-use PHS 300 million yen (-30.1% over the same quarter of the previous year). There was a rebound in demand after consumers held back in the first half of the year with the end to ¥0 (carrier subsidized) mobile phones, but domestic production showed a large drop, with most of the demand taken by imports. - Wireline network equipment
34.5 billion yen (-9.2% over the same quarter of the previous year). Of which central office switching systems was 2.1 billion yen (-22.2% over the same quarter of the previous year), PBX was 4.8 billion yen (-1.6% over the same quarter of the previous year) and digital transmission equipment was 11.2 billion yen (+5.7% over the same quarter of the previous year) and other transmission equipment was 14.6 billion yen (-16.8% over the same quarter of the previous year). Central office switching systems saw a large drop as public switched telephone networks (PSTN) continued to migrate to IP networks, and PBX demand remained flat, but new installment and replacement demand are expected to pick up. Digital transmission equipment showed positive growth for the quarter, but it is expected to revert to negative figures with an end to the investment cycle. - Wireless network equipment
38.6 billion yen (-19.5% over the same quarter of the previous year). Of which fixed telecommunication devices was 10.4 billion yen (-30.3ver the same quarter of the previous year) and base station equipment was 28.1 billion yen (-14.5% over the same quarter of the previous year). Infrastructure investments, including base stations, are increasing in order to accommodate rising data traffic, but the high share of imports led to a drop in domestic production. - Network access equipment
9.0 billion yen (-5.9% over the same quarter of the previous year). Traffic growth from cloud services and IoT is leading to upgrades and increased capital investments, pushing domestic production and total value of equipment upwards. - Wireline parts
6.6 billion yen (+0.3% over the same quarter of the previous year). Mobile phone production in China slowed in the first half, but healthy production of new advanced feature models in the second half resulted in growth of wireline parts for exports.
II. Exports
(Based on Indices of Industrial Production compiled by the Ministry of Exonomics, Trade and Industry)
(1) FY2016 Q3 actual
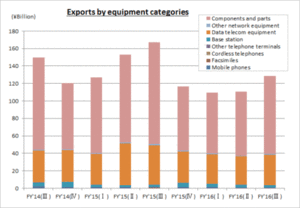
The total figure for exports was 128.7 billion yen (-23.1% over the same quarter of the previous year), recording the 4th consecutive quarter of decrease starting in Q4 of 2015. Telephone sets and terminal equipment continued to record negative year-over-year growth, in addition to the drop in mobile phones all leading to the total negative figure. In network equipment, base stations continued healthy growth from Q1, but two consecutive months of large drops in data communication equipment pushed the entire category into negative growth over the same quarter of the previous year. Increased production of mobile phones in China is contributing to push the total value of parts back to previous levels, but not enough to bring it to that of a year ago.
The aggregate figure from Q1 through Q3 was 348.9 billion yen (-21.9% over the same period of the previous year).
(2) Trend by categories
Actual figures by category are as follows:
- Telephone sets and terminal equipment 900 million yen (-38.8% over the same quarter of the previous year)
Of which, mobile phones was 300 million yen (-35.8% over the same quarter of the previous year), facsimiles was 30 million yen (-64.1% over the same quarter of the previous year), cordless handsets for landline phones was 70 million yen (-15.9% over the same quarter of the previous year) and other was 500 million yen (-40.1% over the same quarter of the previous year). - Network equipment 38.3 billion yen (-22.2% over the same quarter of the previous year)
Of which, base stations was 2.5 billion yen (+5.6% over the same quarter of the previous year), data communication equipment was 34.6 billion yen (-23.8% over the same quarter of the previous year) and other network equipment was 1.1 billion yen (-19.3% over the same quarter of the previous year). - Parts (both wireline and wireless) 89.5 billion yen (-23.3% over the same quarter of the previous year)
(3) Actual figures by region
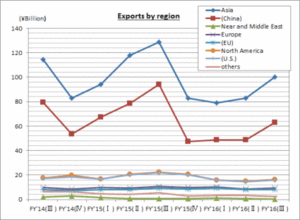
By region, Asia was 100.4 billion yen (-21.9% over the same quarter of the previous year), of which China was 63.0 billion yen (-33.1% over the same quarter of the previous year). North America was 16.2 billion yen (-27.0% over the same quarter of the previous year), of which the U.S. was 15.9 billion yen (-27.7% over the same quarter of the previous year). Europe was 9.3 billion yen (-11.3% over the same quarter of the previous year), of which the EU was 8.2 billion yen (-12.9% over the same quarter of the previous year). The export of parts to China was 57.8 billion yen, accounting for 91.8% (90.3% in Q1) of the 63.0 billion yen total exports to China and 64.6% (63.1% in Q1) of 69.6 billion yen total exports of parts – all indicating high dependency on exports of mobile phone parts to China.
(4) Comparison and breakdown by regions
| First: | Asia 78.0%(+5.9% over the same quarter of the previous year) |
| Second: | North America 12.6%(-2.0% over the same quarter of the previous year) |
| Third: | Europe 7.2%(-2.0% over the same quarter of the previous year) |
| Other regions: | 2.2%(-1.9% over the same quarter of the previous year) |
III. Imports
(Based on Indices of Industrial Production compiled by the Ministry of Exonomics, Trade and Industry)
(1) FY2016 Q3 actual
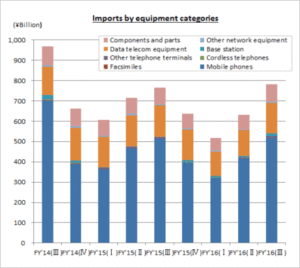
The total figure for exports was 783.0 billion yen (+2.1% over the same quarter of the previous year), recording the first positive quarterly growth since the second quarter of FY2015. The demand for mobile phones, which makes up 66.4% of total imports, shows signs of rebounding after the large drop in the first half of the year plus domestic demand for base stations recorded 641.1% positive growth with the surge in infrastructure investments.
The aggregate figure from Q1 through Q3 was 1.932 trillion yen (-7.4% over the same period of the previous year).
(2) Trend by categories
Actual figures by category are as follows:
- Telephone sets and terminal equipment 524.9 billion yen (+0.9% over the same quarter of the previous year)
Of which, mobile phones was 520.3 billion yen (+1.0% over the same quarter of the previous year), facsimiles was 1.5 billion yen (+7.9% over the same quarter of the previous year), cordless handsets for landline phones was 1.5 billion yen (-12.3% over the same quarter of the previous year) and other was 1.6 billion yen (-16.7% over the same quarter of the previous year). - Network equipment 171.3 billion yen (+4.2% over the same quarter of the previous year)
Of which, base stations was 15.4 billion yen (+641.1% over the same quarter of the previous year), data communication equipment was 151.3 billion yen (-3.3% over the same quarter of the previous year) and other network equipment was 4.6 billion yen (-20.8% over the same quarter of the previous year). - Parts (both wireline and wireless) 86.9 billion yen (+5.7% over the same quarter of the previous year)
(3) Actual figures by region
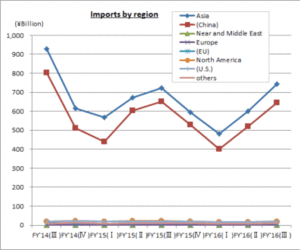
By region, Asia was 743.0 billion yen (+2.6% over the same quarter of the previous year), of which China was 643.9 billion yen (-0.9% over the same quarter of the previous year). North America was 18.8 billion yen (-11.1% over the same quarter of the previous year), of which the U.S. accounted for 18.1 billion yen (-9.7% over the same quarter of the previous year). Europe was 9.4 billion yen (-11.7% over the same quarter of the previous year), of which the EU was 9.3 billion yen (-11.3% over the same quarter of the previous year). Mobile phones from China amounted to 487.6 billion yen, which accounts for 93.7% of the total figure for mobile phone imports, which was 520.3 billion yen.
(4) Comparison and breakdown by regions
| First: | Asia 94.9% (+1.4% over the same quarter of the previous year) |
| Second: | North America 2.4% (-0.9% over the same quarter of the previous year) |
| Third: | Europe 1.2% (-0.3% over the same quarter of the previous year) |
| Other regions: | 1.5% (-0.2% over the same quarter of the previous year) |
IV. Trends in Orders Received and Shipped
(from CIAJ statistics)
CIAJ statistics for total orders received and shipped amounted to 513.4 billion yen (-0.2% over the same quarter of the previous year) for the quarter.
VoIP-GW, intercoms, multi-functioning personal facsimiles, other mobile terminal equipment, media converters, terrestrial fixed communication equipment (for satellite), base stations and other network equipment (routers, LAN switches) recorded positive growth over the same quarter of the previous year
The total value of domestic shipments was 409.7 billion yen (+1.2% over the same quarter of the previous year) and exports was 103.7 billion yen (-5.2% over the same quarter of the previous year).
For details, contact
Market Research
CIAJ
tel: 81-3-5403-9356 fax: 81-3-5403-9360
For more general inquiries, contact
Corporate Communications
CIAJ
tel: 81-3-5403-9351 fax: 81-3-5403-9360
